Are you a leader of your project management team or you are the chief executive of your business team, and everyone looks at you in identifying problems and their causes? You want to get rid of unclear paperwork regarding the problems and causes, and want to outshine in the group setting by explaining clearly the problems and the causes, then this article is for you.
In project management and other aspects of business, fishbone diagrams are widely used in identifying the problems and the causes. Creating fishbone diagrams from the stretch is time-consuming and hard, so editable fishbone diagram templates (and charts) are the solution to this issue.
How you can use these editable fishbone diagram templates (and charts) to know this, you have to spare your few minutes to read this insightful article. So without further ado let’s dive into this read.
What is the meaning of the fishbone diagram?
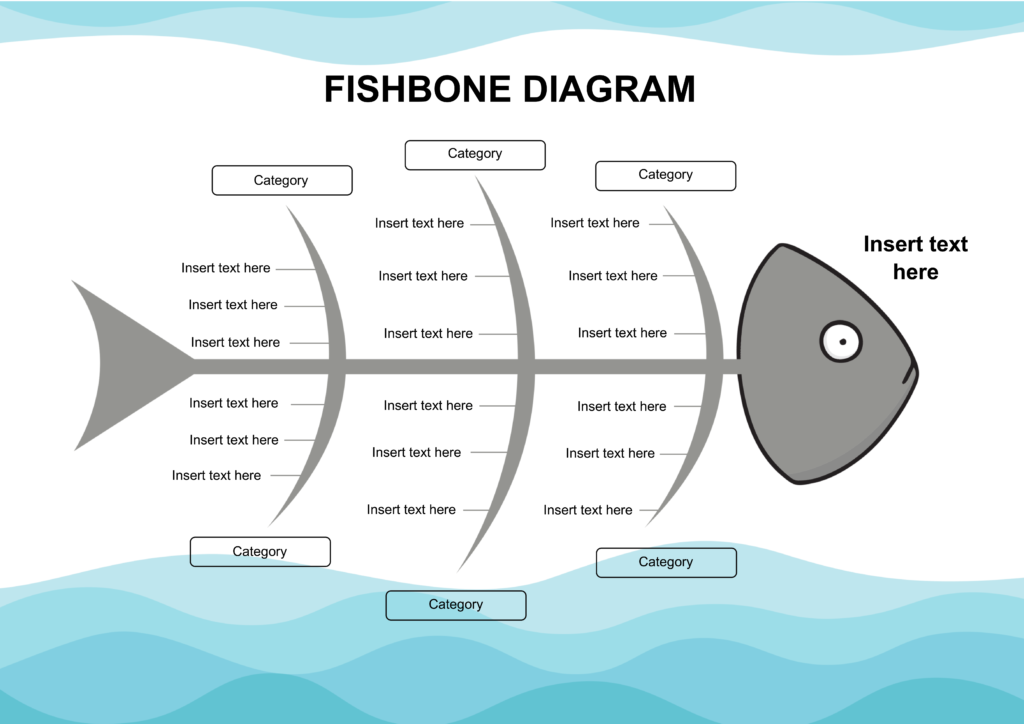
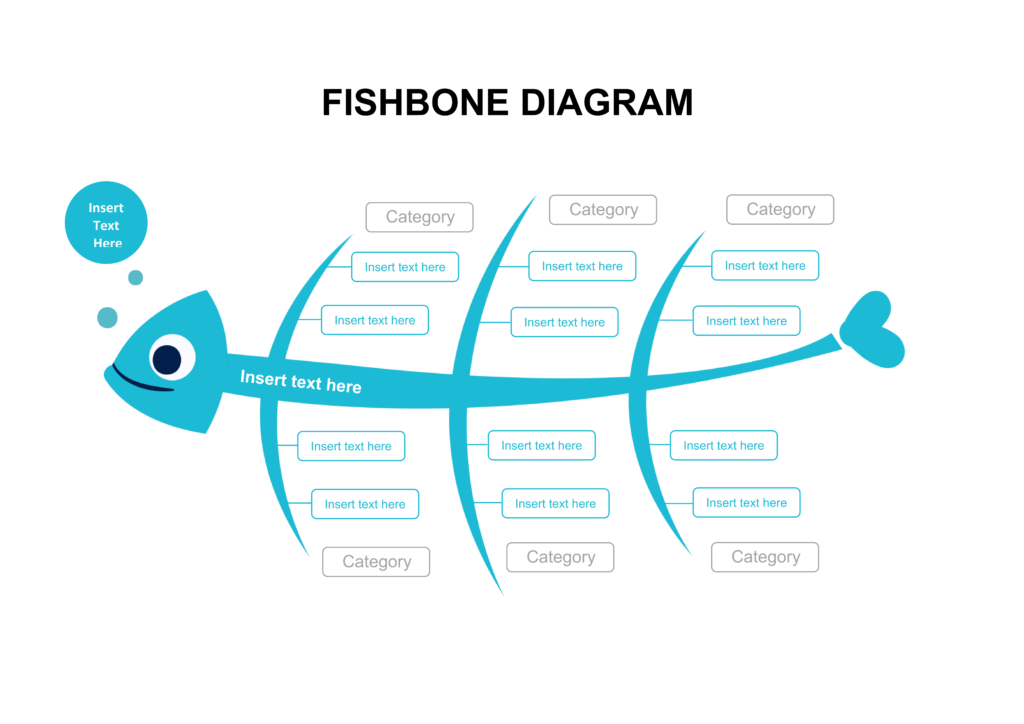
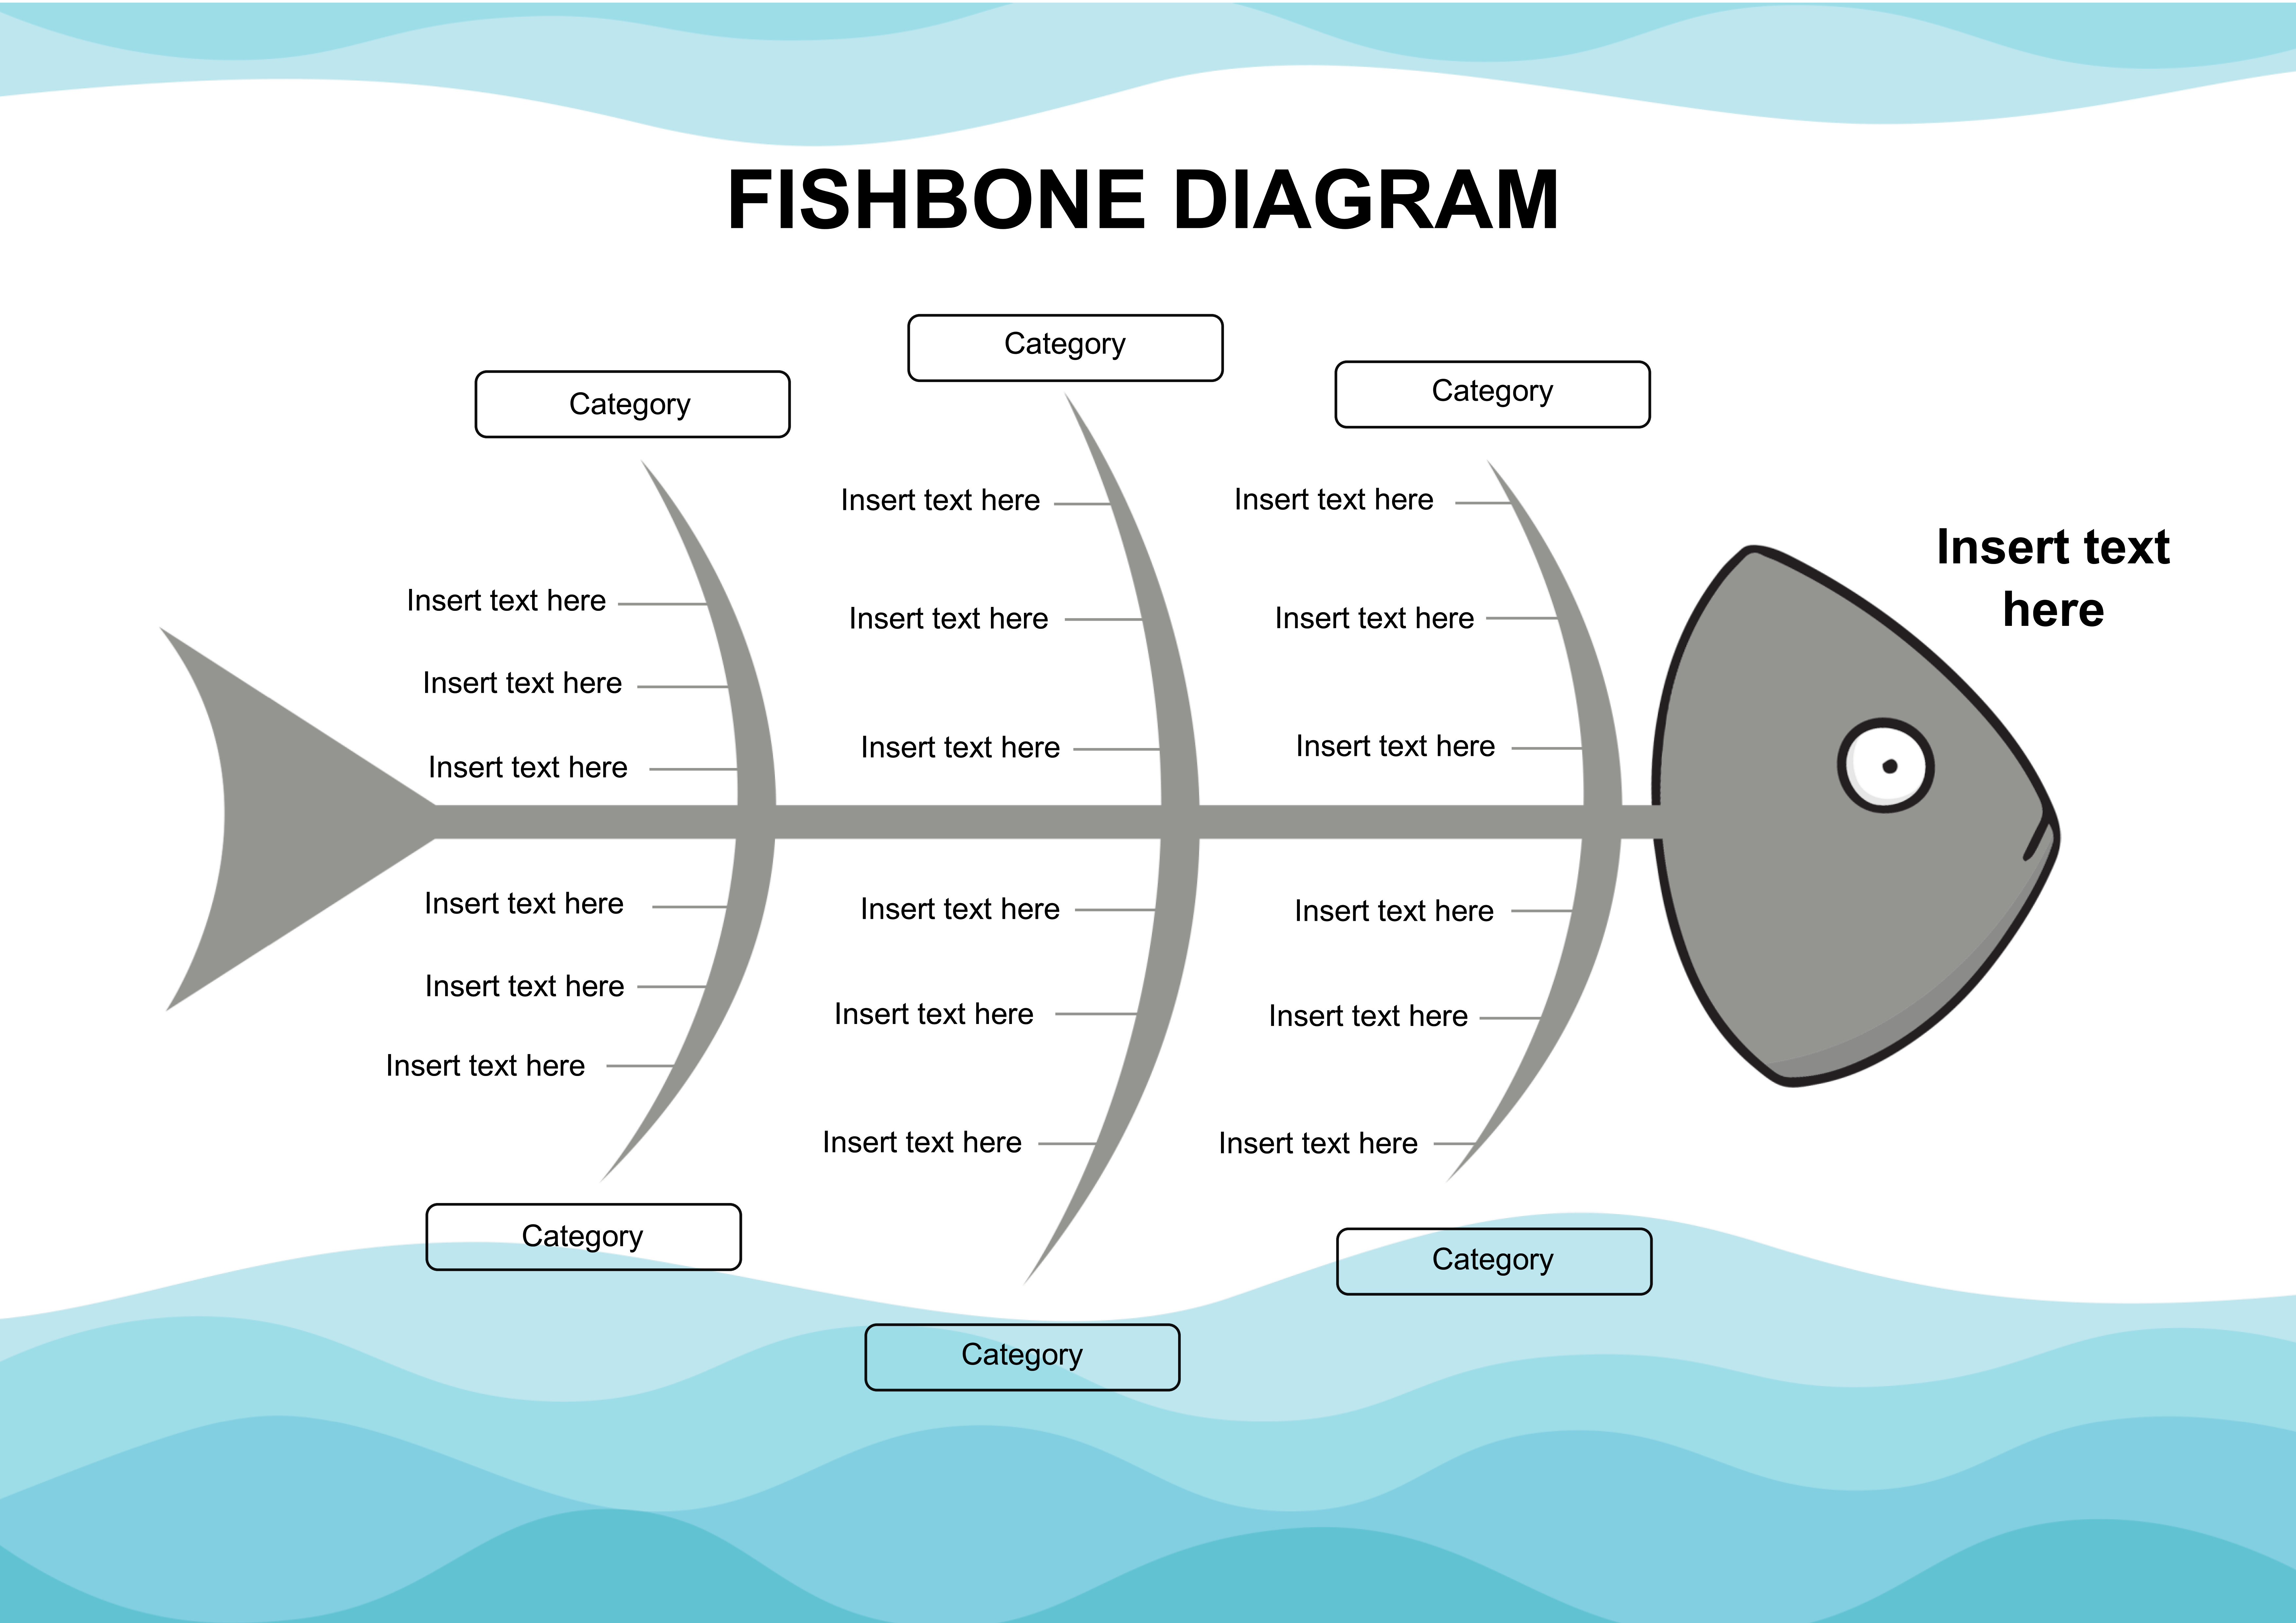
A fishbone diagram also called a cause-and-effect diagram and an Ishikawa diagram. As it is clear from its name that it is a cause-and-effect diagram so it helps in brainstorming to identify causes of problems, and also categorize the ideas for better understanding.
By using a fishbone diagram you can learn from past mistakes and avoid problems in the future. These cause-and-effect diagrams are available in Word and PPT on different sites for free download.
Fishbone Diagram & Chart Template 01

Fishbone Diagram & Chart Template 01

5 Tips to make amazing fishbone diagrams in MS Word
Here are five tips for you to make a professional fishbone diagram for your project management setting or any other business setting:
1 Addition of text space
Emphasizing of addition of text space is for such fishbone diagrams which only allow writing down one to two words. These diagrams are not meant to write sentences. That’s why leave some space on the page so that people can write or make notes about causes.
2 Use Colors sensibly
The correct use of colors in the fishbone diagram is very important when you show grouping or categories. A different color for each category shows separation from the next category or group. Different color for different categories helps your team to focus and understand the discussion.
3 Project fishbone diagram on a big screen
When you start creating a PPT presentation of a fishbone diagram for a brainstorming session, also make sure that the diagram is in an MS word document. Through this, you will make sure that all fishbone diagrams that you have are the same.
4 Distribute the confirmed fishbone diagram to the teammates
Well, this step comes when you finish the brainstorming session. Distribute the final fishbone diagram and the results of your analysis to all the teammates. When you finally find the main causes of problems then you can easily avoid the same issue in the future.
5 The final step
The final step is to act immediately on the problems that need to be fixed. Go along with an action plan and the fishbone diagram. Working on the main problem with an effective action plan and the Ishikawa diagram gives efficiency to your analysis.
Conclusion
Editable fishbone diagrams templates (and charts) are a prime aspect for any project management team to find the causes and the problems. Such diagrams help in the brainstorming of the teams regarding the issues of the projects. We put our best to bring you useful insights about editable fishbone diagrams, and if you find this article useful then kindly share it.
