Trigonometry is the subject of study which you may encounter many times. It comes in the form of angles, trigonometric ratios like sin, cos, tan, cosine, etc. The Law of trigonometry is derived from nature so you often have encountered them. In terms of trigonometry, the unit circle chart or diagrams holds very much importance. It is the best tool used by mathematicians and students. To ease your work you can download printable unit chart diagrams. If you are a student, then it is very important to comprehend this concept. Here I will mention some key points of trigonometry.
First of all, take the basic concept of the unit circle. For this let’s consider what are unit circles and unit circle diagrams.
What are the Unit Circle and Unit Circle Charts?
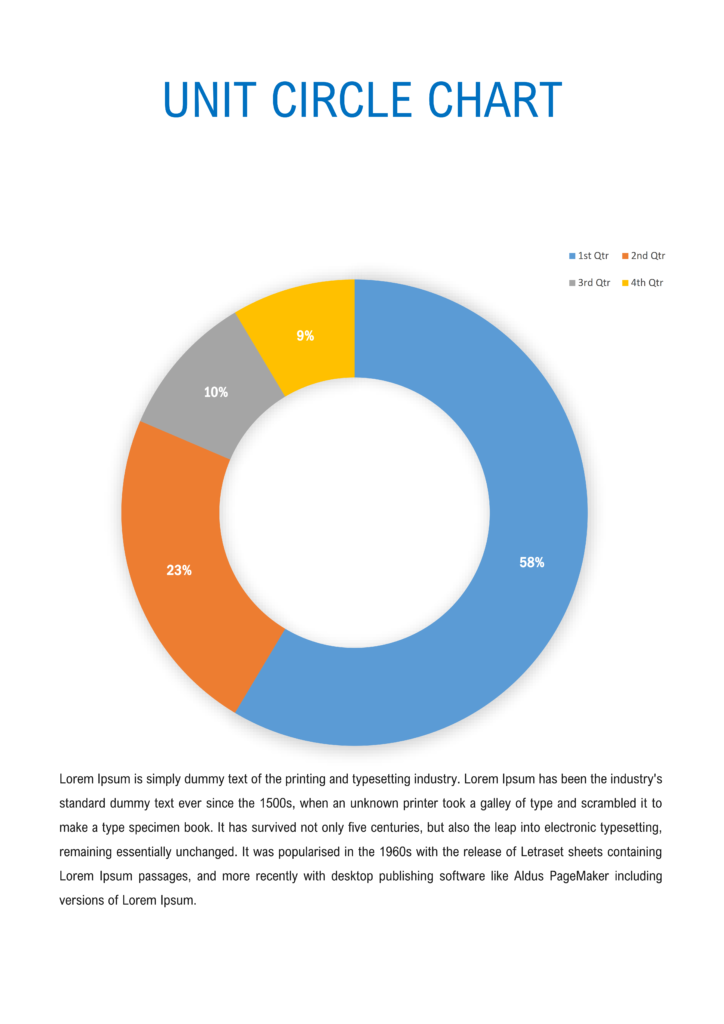
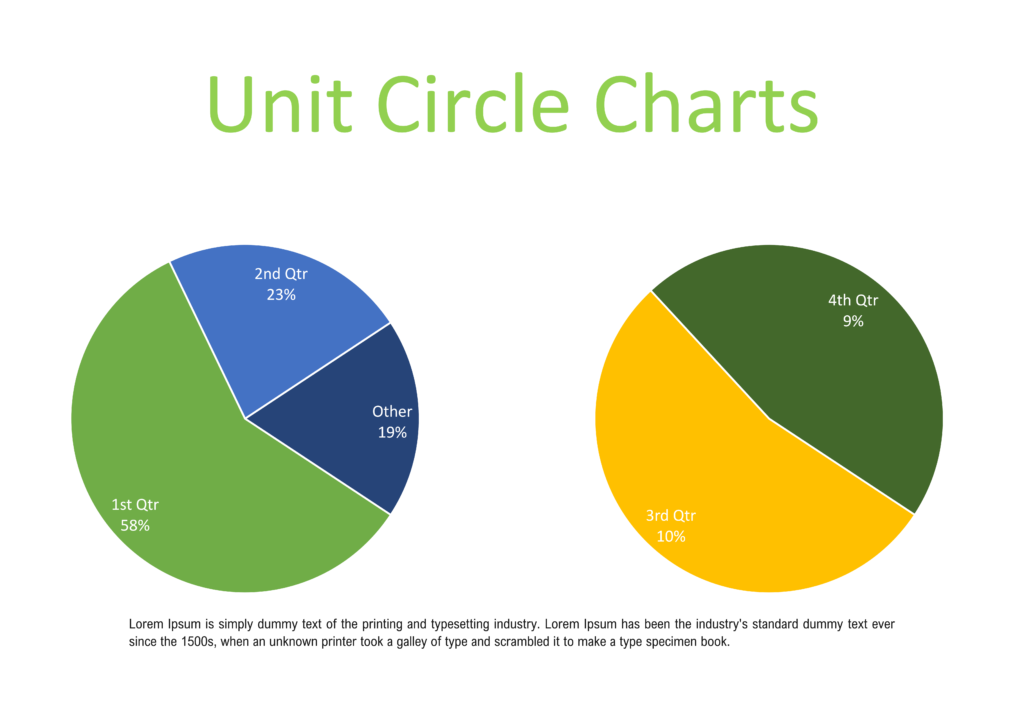
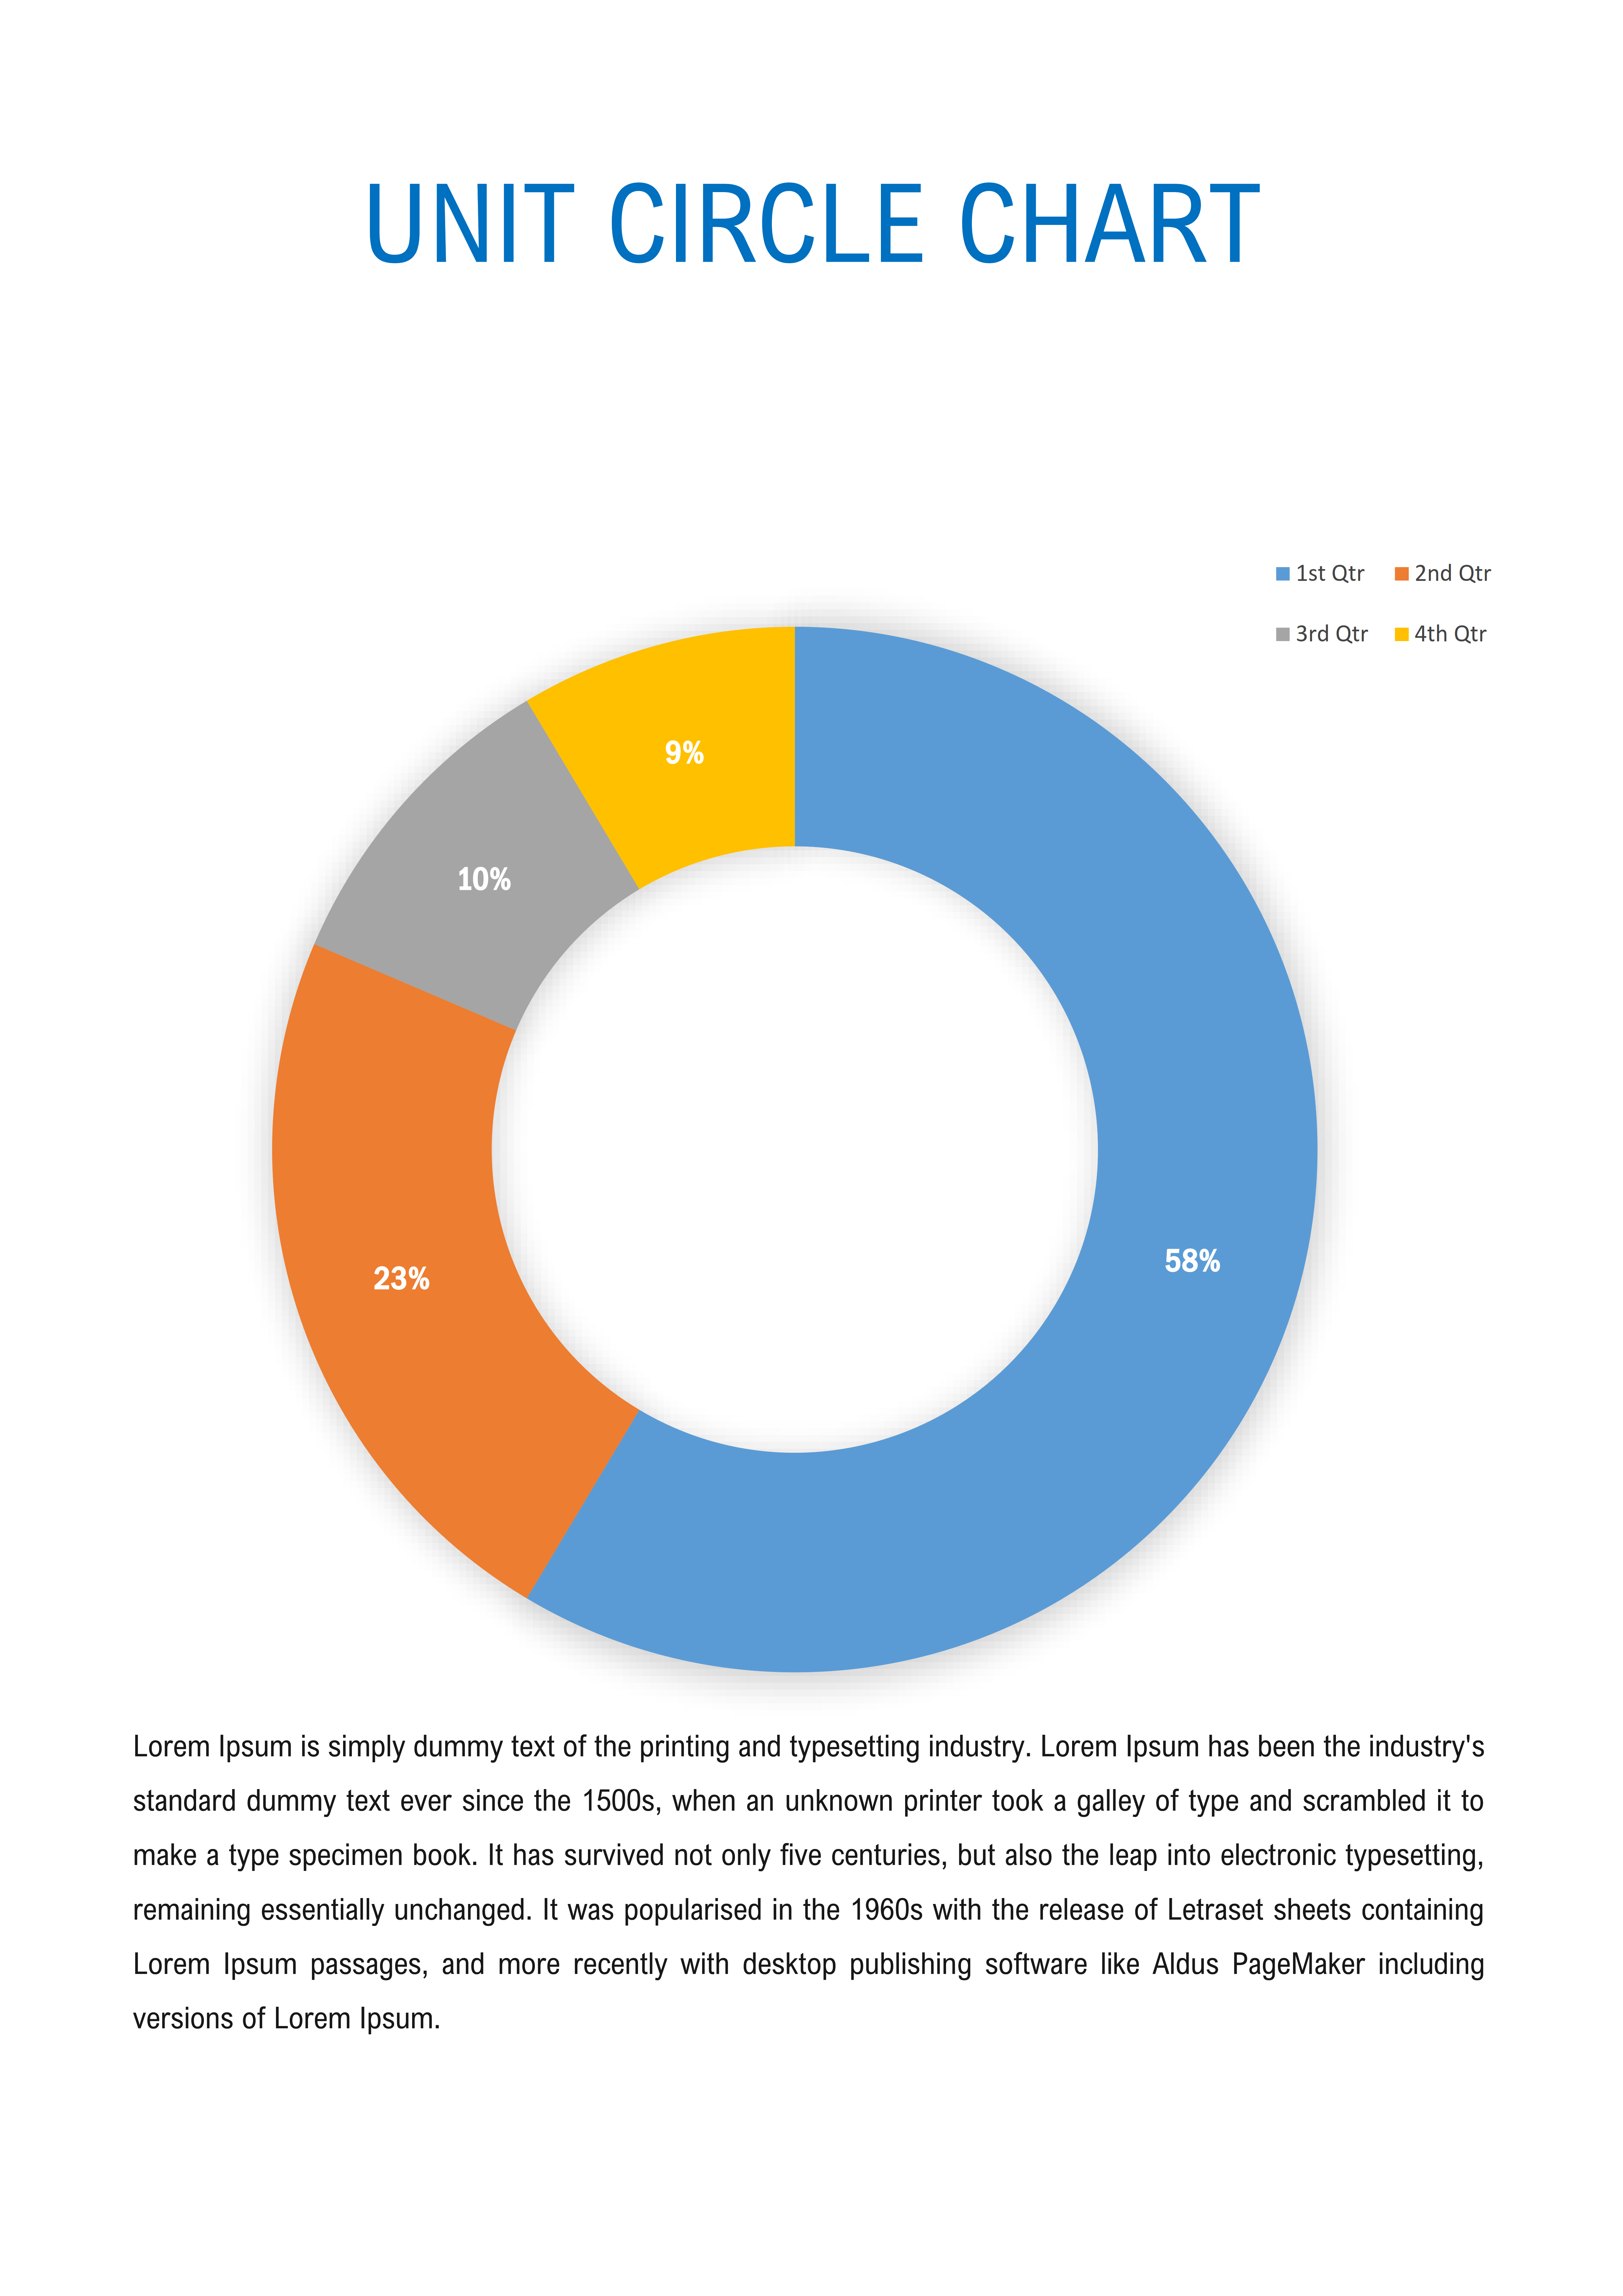
The Unit Circle is a geometrical circular shape that has a radius of one. It is located at the origin with coordinates (0, 0) in the Cartesian plane. However, the unit circle chart shows the position of coordinates on the unit circle that is formed by dividing the circle into equal segments. It is used to explain trigonometry. It shows all angles between 0° to 360 °. No doubt trigonometric laws are derived using a right-angle triangle but the circle is a shape that provides all necessary information about angles that exist.
Unit Circle Charts Template 01

Unit Circle Charts Template 01

More about Angles in the Unit Circle diagram:
In a unit circle, angles are measured from 0° to 360 °. The measure of angles starts from the positive x-axis as the initial side of the angle and measuring to the negative x-axis in the counter-clockwise direction is equal to 180 °. Usually, a normal straight line is measured 180 ° on the origin. Similarly, the next rotation from the negative x-axis to the positive x-axis completes the 360 ° angle on origin. When the terminal side of the angle is rotated in a clockwise direction we achieve the negative angles. There is an angle “90 °” that is considered the perpendicular or normal angle. In short, a unit circle chart is a combination of the angles drawn on the Cartesian plane.
Rotation Of terminal Side of Angle:
It is the rotation of the terminal side of the angle that determines the measure of an angle and the initial side lies on the positive x-axis. On one rotation it completes the 360 ° on the second rotation it completes the 720 ° and so on. It also means 90 ° and 450 ° are equal. Angles are also measured in radians. Radian is a unit of measurement of the angle subtended at the center of the circle by an arc whose length is equal to the radius. Normally angles are measured in radians which are the SI unit. It is equal to angles in degrees equal to π divided by 180. 1 radian is equal to 57.7 °.
How can you draw your unit circle diagram?
Drawing a circle diagram can be a difficult and challenging task but you can draw it using these mentioned steps. However, if you still find it difficult we provide free-download unit circle charts to ease your process. It not only reduces the time consumed but also energy.
- First, draw a Cartesian plane and then draw a mark where 60 ° angle in a unit circle lies using the protractor in the first quadrant.
- Now link the marked point with origin through a straight line.
- Your angle should be in the first quadrant and acute angle. An acute angle is an angle that lies between 0 to 90 °.
- The next step is to draw a perpendicular that is normal to the x-axis of the coordinate and lies on the y-axis. This is the 90 ° angle or π /2 radian.
- After joining the terminals, a right-angled triangle with perpendicular, hypotenuse, and base is formed. The hypotenuse is the largest line of the right-angled triangle.
- Then measure the length of hypotenuses you have drawn. It should be one because the unit circle is a circle with a radius of one.
- The next step is to measure the length of the other sides. You can do this by multiplying the measured length of the larger side by 2 and dividing the smaller side by 2.
- Identify the point on the unit circle drawn. It should be located on the origin of the Cartesian plane. Every point on the circle will have coordinate points too. The coordinate point consists of abscissa and ordinate where the x-axis is the abscissa and y-axis is the ordinate. You can name point on the 60 ° angle drawn.
These are the easy steps to draw your circle chart but still if you think it is difficult for you just download the already created unit circle chart templates to minimize the strength you need to spend to draw it from scratch.
Here is the unit circle charts template available in the word and pdf format:
Basic Ratios of Trigonometry:
Trigonometry is all about sin, cos, tan, cosec, sec, etc. These are the basic trigonometric ratios that are equal to the division of the sides of the right-angled triangle. Let’s know what these are:
- Sin is equal to the ratio of the perpendicular and hypotenuse
- Cosine is the ratio of the base and hypotenuse
- Tangent is the ratio of the perpendicular and base
- Cosecant is the ratio of the hypotenuse and perpendicular. It is the reciprocal of sin function
- Secant is the ratio of hypotenuse and base. It is reciprocal of the cosine function.
- Cotangent is the ratio of the base and perpendicular. It is reciprocal of the tan function.
There are some other functions too like an inverse of sine, cosine, tangent, etc. You can remember some special angles like π / 6, π /2, π / 3, or π . You have to remember values for these angles against trigonometric ratios. These trigonometric ratios share some domains and ranges like Sin theta has the domain of – π /2 and π /2 and range of -1 to 1.
